
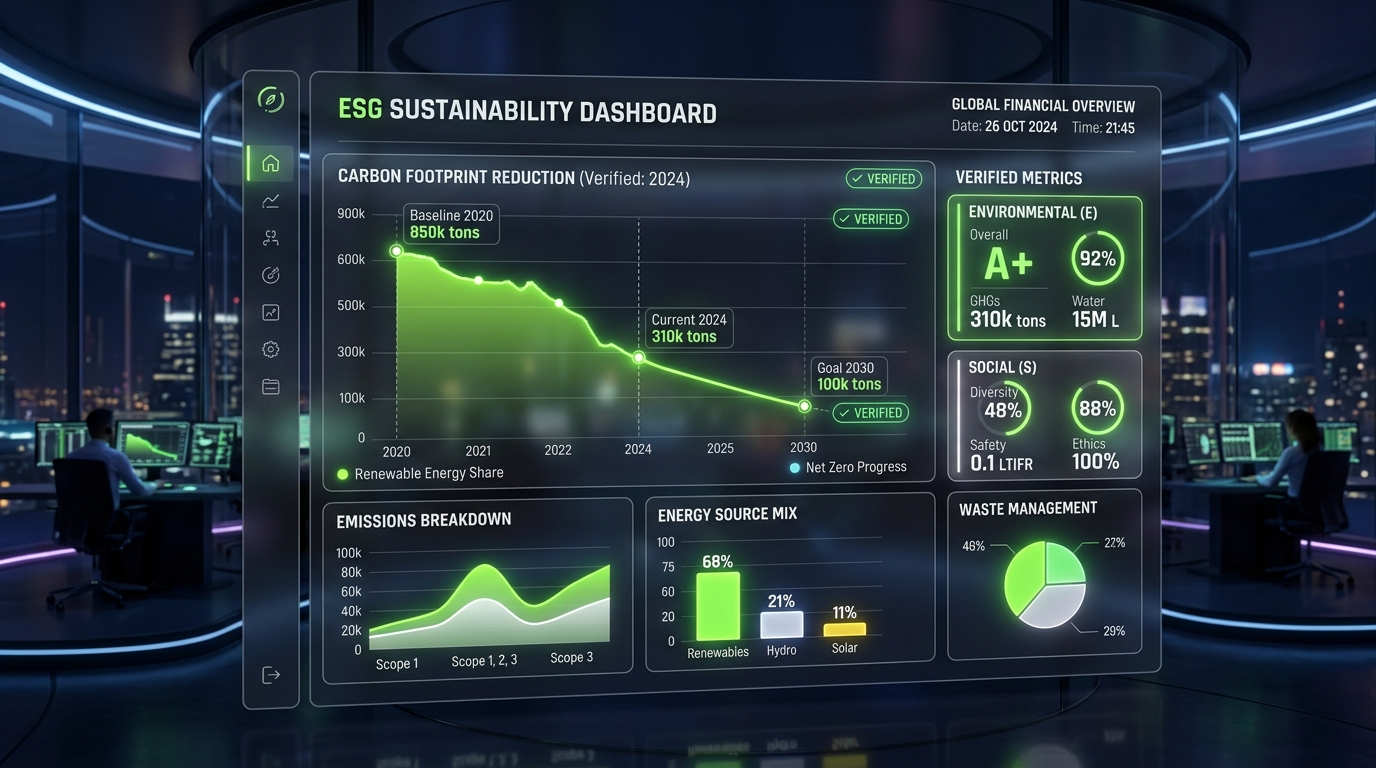
In recent years, sustainability has evolved from a peripheral ethical concept into a core pillar of Venture Capital and corporate finance worldwide. However, with the rapid growth of ESG (Environmental, Social, Governance) investment strategies, the market has witnessed a parallel surge in superficial impact reporting — often lacking rigorous scientific or accounting foundation: a phenomenon known as Greenwashing.
Today, institutional investors, regulators, and industrial partners demand a definitive leap in quality. Qualitative sustainability reports or abstract statements of intent are no longer enough. The new era of impact finance demands an analytical framework built on traceable, transparent environmental KPIs that mathematically correlate with financial KPIs.
In this article, we outline how to navigate greenwashing risks by adopting objective quantification methodologies, IoT/blockchain data traceability, and mandatory regulatory frameworks like the EU Taxonomy and CSRD directive.
1. The Credibility Crisis of Traditional ESG Frameworks
For over a decade, ESG ratings issued by third-party rating agencies relied heavily on procedural compliance rather than real-world impact. A corporation could achieve high ESG scores simply by thoroughly filing internal policies — without reducing a single ton of carbon dioxide emissions on the ground.
Traditional Model (Qualitative)   ➔  Self-declared questionnaires ➔  High Greenwashing Risk
Advanced Model (Real-Time Data)   ➔  IoT + Sensors + LCA          ➔  Audited & Certified KPIs
Three Primary Forms of Industrial Greenwashing:
- Selective Metric Reporting (Cherry-Picking): Disclosing metrics on marginal sustainability initiatives while ignoring core business inefficiencies (for example, highlighting office paper recycling while ignoring Scope 3 supply chain emissions).
- Targets Without Scientific Baselines: Pledging “Net Zero by 2050” without interim measurable benchmarks or clear capital allocation plans (CapEx allocation).
- Unverifiable Data: Relying on retrospective annual estimates without continuous, real-time audited monitoring systems.
2. Rigorous Carbon Accounting: Scope 1, Scope 2, and Scope 3
To build transparent impact metrics, accounting infrastructure must align with the GHG Protocol (Greenhouse Gas Protocol), explicitly distinguishing between three emission perimeters:
| Boundary | Technical & Operational Definition | Industrial Calculation Examples | Tracking Complexity |
|---|---|---|---|
| Scope 1 | Direct emissions from owned or controlled sources | Combustion in boilers/reactors, vehicle fleets, refrigerant leaks | Low (direct measurement on meters and tanks) |
| Scope 2 | Indirect emissions from purchased energy generation | Purchased electricity grid consumption, district heating, industrial steam | Medium (based on supplier energy mixes) |
| Scope 3 | All other indirect emissions throughout the value chain | Raw material extraction, supplier freight, product use & end-of-life | Very High (requires supply chain data integration) |
The core challenge for sustainable industry lies in tracking Scope 3 emissions, which typically represent over 80% of an industrial asset’s total ecological footprint.
3. Comparative Matrix: Financial KPIs vs. Traceable Environmental KPIs
Successful sustainable portfolios do not treat environmental parameters as passive constraints; they embed them directly into financial return models (Risk-Adjusted Return).
+----------------------------------------+----------------------------------------+
|       CLASSIC FINANCIAL KPI            |     TRACEABLE ENVIRONMENTAL KPI        |
+----------------------------------------+----------------------------------------+
| EBITDA / Invested Capital              | CO₂e Avoided per Euro CapEx (tCO₂e/€)   |
| Return on Invested Capital (ROIC)      | Material Circularity Index (MCI %)     |
| Free Cash Flow to Firm (FCFF)          | Specific Water Intensity (Liters/Unit) |
| Cost of Goods Sold (COGS)              | Primary Energy Efficiency (kWh/t)      |
+----------------------------------------+----------------------------------------+
Key Integrated Metrics:
- Marginal Abatement Cost: Measures the economic efficiency of ecological investments. Calculates the net cost (or savings) for every metric ton of CO₂e avoided by introducing a new Deep-Tech or automation technology.
- Intensity Metrics: Rather than measuring absolute emissions alone, these correlate emissions directly with industrial output volume (e.g., $kgCO_2 / kg$ of product). This prevents temporary production drops from being mistaken for genuine efficiency gains.
- Material Circularity Indicator (MCI): Quantifies the percentage of recycled or reused materials entering production relative to non-recoverable waste sent to landfills.
4. Digital Traceability: IoT Sensors, Blockchain, and Digital Twins
Overcoming greenwashing requires shifting from manual spreadsheets to automated environmental data collection. Integrating advanced digital technologies guarantees environmental data immutability and accuracy:
A. Industrial IoT Sensors & Edge Computing
Installing smart meters and environmental sensors directly on production lines enables continuous monitoring of energy consumption, effluent discharge, and process leaks — eliminating human manipulation.
B. Blockchain / DLT Notarization
Data streams generated by IoT infrastructure can be recorded on distributed ledgers (DLT/Blockchain). Immutable timestamps prevent retrospective alteration, providing external environmental auditors with an unassailable audit trail.
C. Digital Twins for Life Cycle Assessment (LCA)
Building a digital twin of an industrial plant allows real-time simulation of process modifications on total footprint, evaluating operational scenarios before committing financial capital.
5. Regulatory Landscape: EU Taxonomy, CSRD, and SFDR
European regulations establish clear criteria to combat greenwashing across finance and industry:
- EU Environmental Taxonomy: Technical classification defining when an economic activity qualifies as “environmentally sustainable.” To comply, an activity must substantially contribute to at least one of six EU environmental objectives while causing no significant harm to others (Do No Significant Harm - DNSH).
- Corporate Sustainability Reporting Directive (CSRD): Mandates adoption of ESRS (European Sustainability Reporting Standards), enforcing Double Materiality: companies must report both how environmental factors impact financial performance and how operational activities impact society and the environment.
- SFDR (Sustainable Finance Disclosure Regulation): Categorizes investment funds into Article 6 (no sustainability integration), Article 8 (promotes environmental/social characteristics), and Article 9 (explicit sustainable impact goals).
6. Strategic Outlook for Holdings and Investors
Measuring ESG impact scientifically is not merely a compliance burden; it is a critical strategic positioning choice. Companies unable to prove process sustainability through audited metrics will face rising capital costs, regulatory penalties, and asset devaluation risks (stranded assets).
For forward-looking investors like Mantohn SA, adopting traceable environmental KPIs on equal footing with traditional financial metrics is the only reliable way to allocate capital into industrial technologies capable of delivering real, long-term shared value.